This is an addition to the Mendix hardware survey article. For full transparency, I put the research results of the benchmark analysis in this blogpost. So anyone can double check my findings. As I don’t expect many people to read this, I’m not formatting this perfectly as I would a more public blogpost. Feel free to add your thoughts!
A note on limitations
The most powerful hardware often combines different aspects to achieve its results, so it is difficult to make conclusions on single components. If a PC performs well but has both a powerful CPU and GPU, it is hard to conclude which component contributes to its success.
I singled out some components in my own PC, swapping components to single out differences. But n=1.
Overall the sample size for this research is quite small. While trends are visible, it is hard to draw definitive conclusions on anything. In addition, this is not my area of expertise at all, so whilst I did my best to perform a proper analysis, it’s likely I made mistakes or “scientific faux pas” along the way.
That being said, I feel some trends are definitively visible, and the main conclusion holds up: there is a huge difference in performance across devices, so picking the right hardware matters.
CPU
MX Benchmark vs PassMark scores
I am interested whether a PassMark score correlates with the benchmark results. I looked up every CPU on PassMark and added the score to the Excel. Then, we can plot the Benchmark vs PassMark scores:
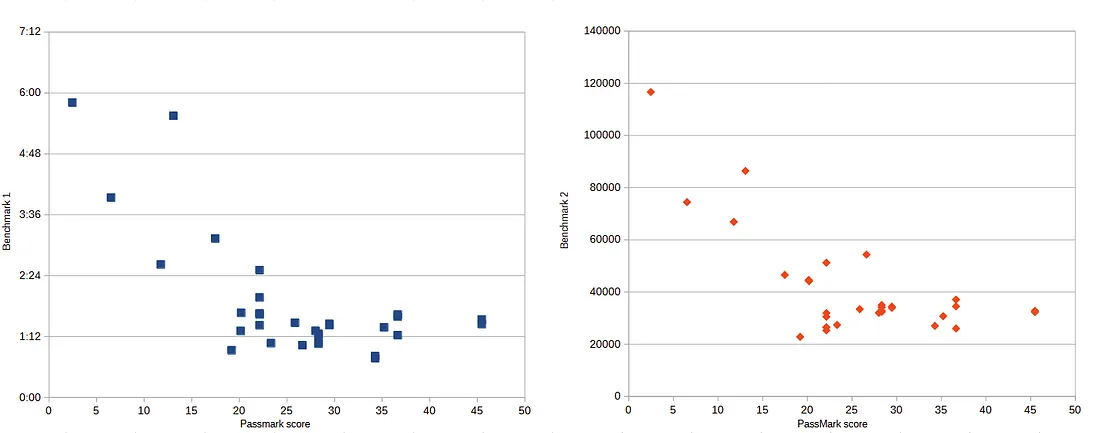 Benchmark scores (Y-axis) vs. PassMark scores (Y-axis)
We can definitely see a correlation, though not linear. Improvements seem to cap around a 20K PassMark score. Also, the highest PassMark score (45,478 for AMD Ryzen 9 5950X with a Benchmark2 score of 32316) is about 20% slower than a CPU that scores much lower on PassMark (34271 for AMD Ryzen 7 7800X3D with a Benchmark2 score of 27098).
Cores vs. singlethreaded performance
Next, it would be interesting to see what contributes more towards performance: more cores or better singlethreaded performance?
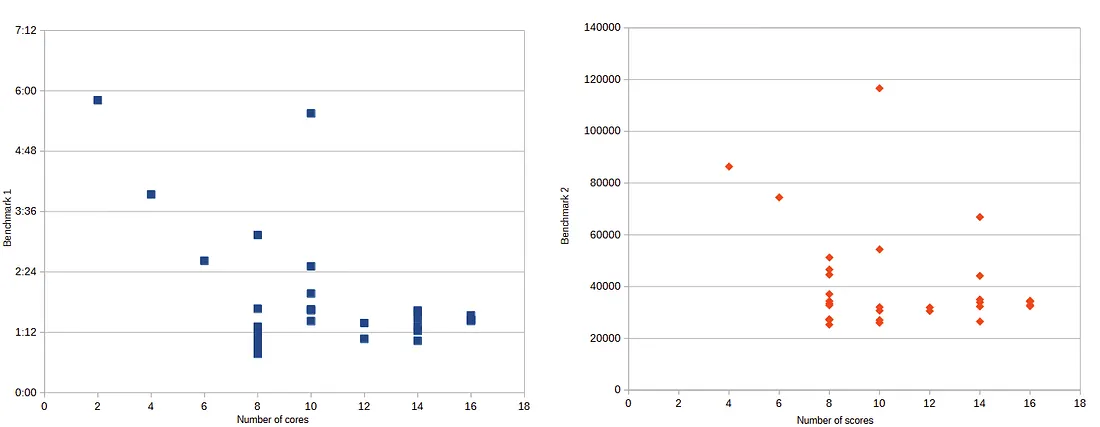 Benchmark scores vs. number of cores
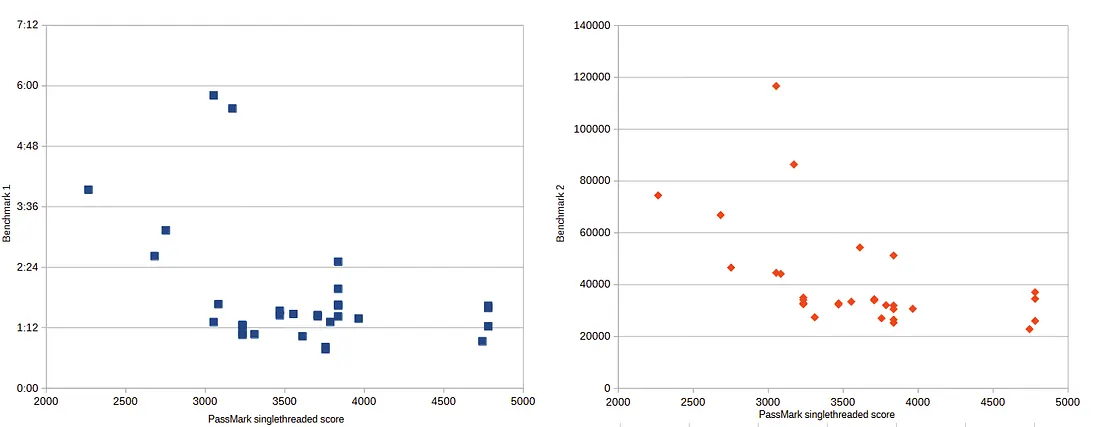 Benchmark scores vs. singlethreaded score by PassMark
We see a similar trend as for the PassMark overall scores: more cores/better singlethreaded performance is a better benchmark score.
 Raw data for CPU analysis
RAM
For RAM, we can explore RAM speed and amount.
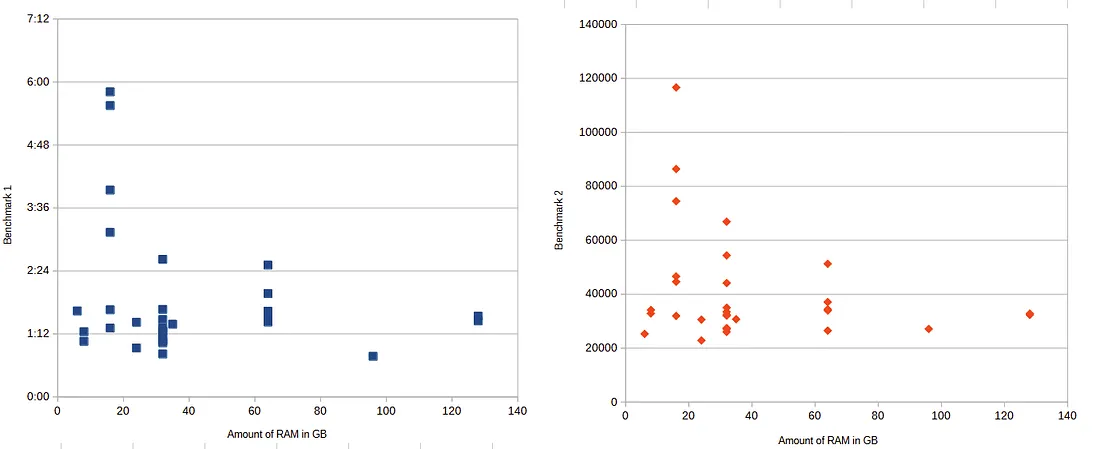 RAM amount in GBs vs. Benchmark scores
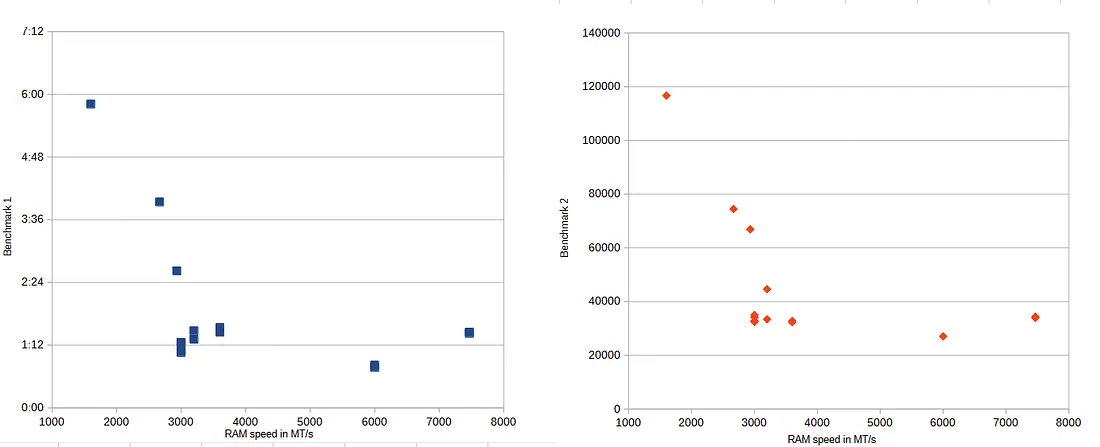 RAM speed vs. Benchmark scores
Although the results trend slightly downwards, RAM amount does not seem to impact performance much. The best results are already achieved in the bottom left of the chart, even though that means a low amount of RAM and a high benchmark result. Either way, I always recommend getting at least 16GB of RAM nowadays.
RAM speed does seem to affect performance, but it is likely that lower RAM speeds are indicitative of an older system lacking in other areas.
Graphics card
Graphics cards show very little activity in Task Manager while running the benchmarks. Graphics card are spread across the board. For example, the Qualcomm Adreno X1–85 GPU has a PassMark score of just 2865 compared to the AMD RADEON RX 7900 XTX GAMING with a PassMark score of 31113, with comparable and both good benchmark scores.
Therefore, I conclude that graphics card do not impact Mendix Studio Pro performance.
 Graphics card PassMark vs. Benchmark scores
Storage
For storage, you could measure benchmark scores vs read and write speeds. While initially I suspected this might have a great impact on performance since Mendix has to write the project to the deployment folder, initial testing already showed very little activity in Task Manager while performing the benchmarks.
The benchmark results tell a similar story.
- Hard drives have slow read/write speeds, but are present in both high and low scoring benchmarks.
- SSDs have fast read/write speeds but are still present in the bottom of the list of benchmark scores.
- There is still an NVMe SSD (the fastest read/write speeds) in the middle of the pack.
Therefore, I conclude that the storage device has little impact on performance.
Operating system
Which type of hardware typically performs the best? I differentiate four kinds:
- Windows PC
- Windows laptop
- MacBook
- MacBook using Parallels
Plotting all outcomes, we can calculate the average result for each type of hardware. Also interesting is plotting the average deviation, so how much variance is there in that hardware type. For this, I used the AVEDEV function.
 Averages per hardware type
We find that PCs score the best in Benchmark 1, while Parallels performs the best in Benchmark 2. PCs also have the smallest deviation for both tests. Windows laptops score the worst and have by far the biggest deviation in scores.
Since there were only a handful of powerful PCs tested, it makes sense they win in most scenarios.
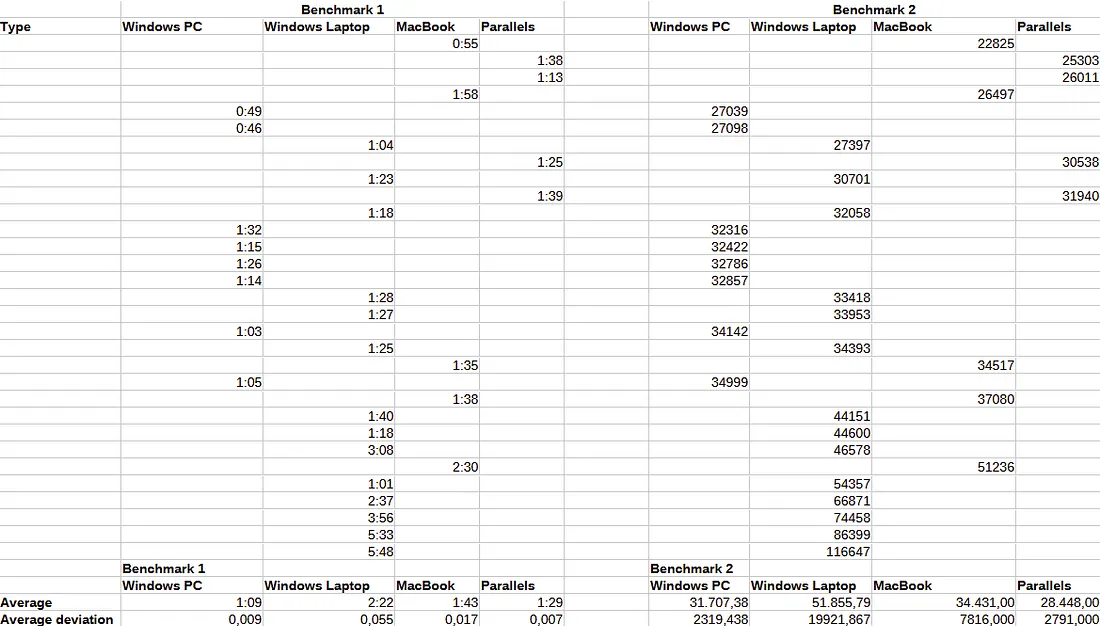 Raw data for hardware type
Benchmark 1 vs Benchmark 2
If the system performs well in Benchmark 1, will it also perform well in Benchmark 2? In other words, is performance consistent across different measurements?
To test this, we can test the correlation between the two scores. First, I normalized the durations to be both in ms, then calculated the correlation coefficient between the two scores using the function =CORREL(B2:B32;C2:C32). The correlation coefficient is 0.905, indicating a very strong relation between the two outcomes.
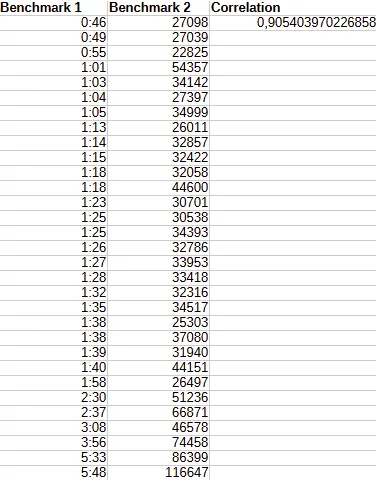 Correlation coefficient between benchmark 1 & 2
Price vs Performance
This would be an interesting topic, were it not too complicated. I decided to leave price-performance out of the analysis.
- Prices vary wildly across regions, and Mendix is a global product.
- MSRP does not mean the price you can actually acquire the hardware for.
- The launch price is not the price you always pay for it, and products can become cheaper over time (but not always).